3. Seldon Monitoring
Grafana & Prometheus
Now, let's perform repeated API requests with the SeldonDeployment we created on the previous page and check if the dashboard changes.
Dashboard
Forward the dashboard created earlier.
kubectl port-forward svc/seldon-core-analytics-grafana -n seldon-system 8090:80
Request API
Request repeated to the previously created Seldon Deployment.
curl -X POST http://$NODE_IP:$NODE_PORT/seldon/seldon-deploy/sklearn/api/v1.0/predictions \
-H 'Content-Type: application/json' \
-d '{ "data": { "ndarray": [[1,2,3,4]] } }'
Furthermore, when checking the Grafana dashboard, you can observe that the Global Request Rate increases momentarily from 0 ops.
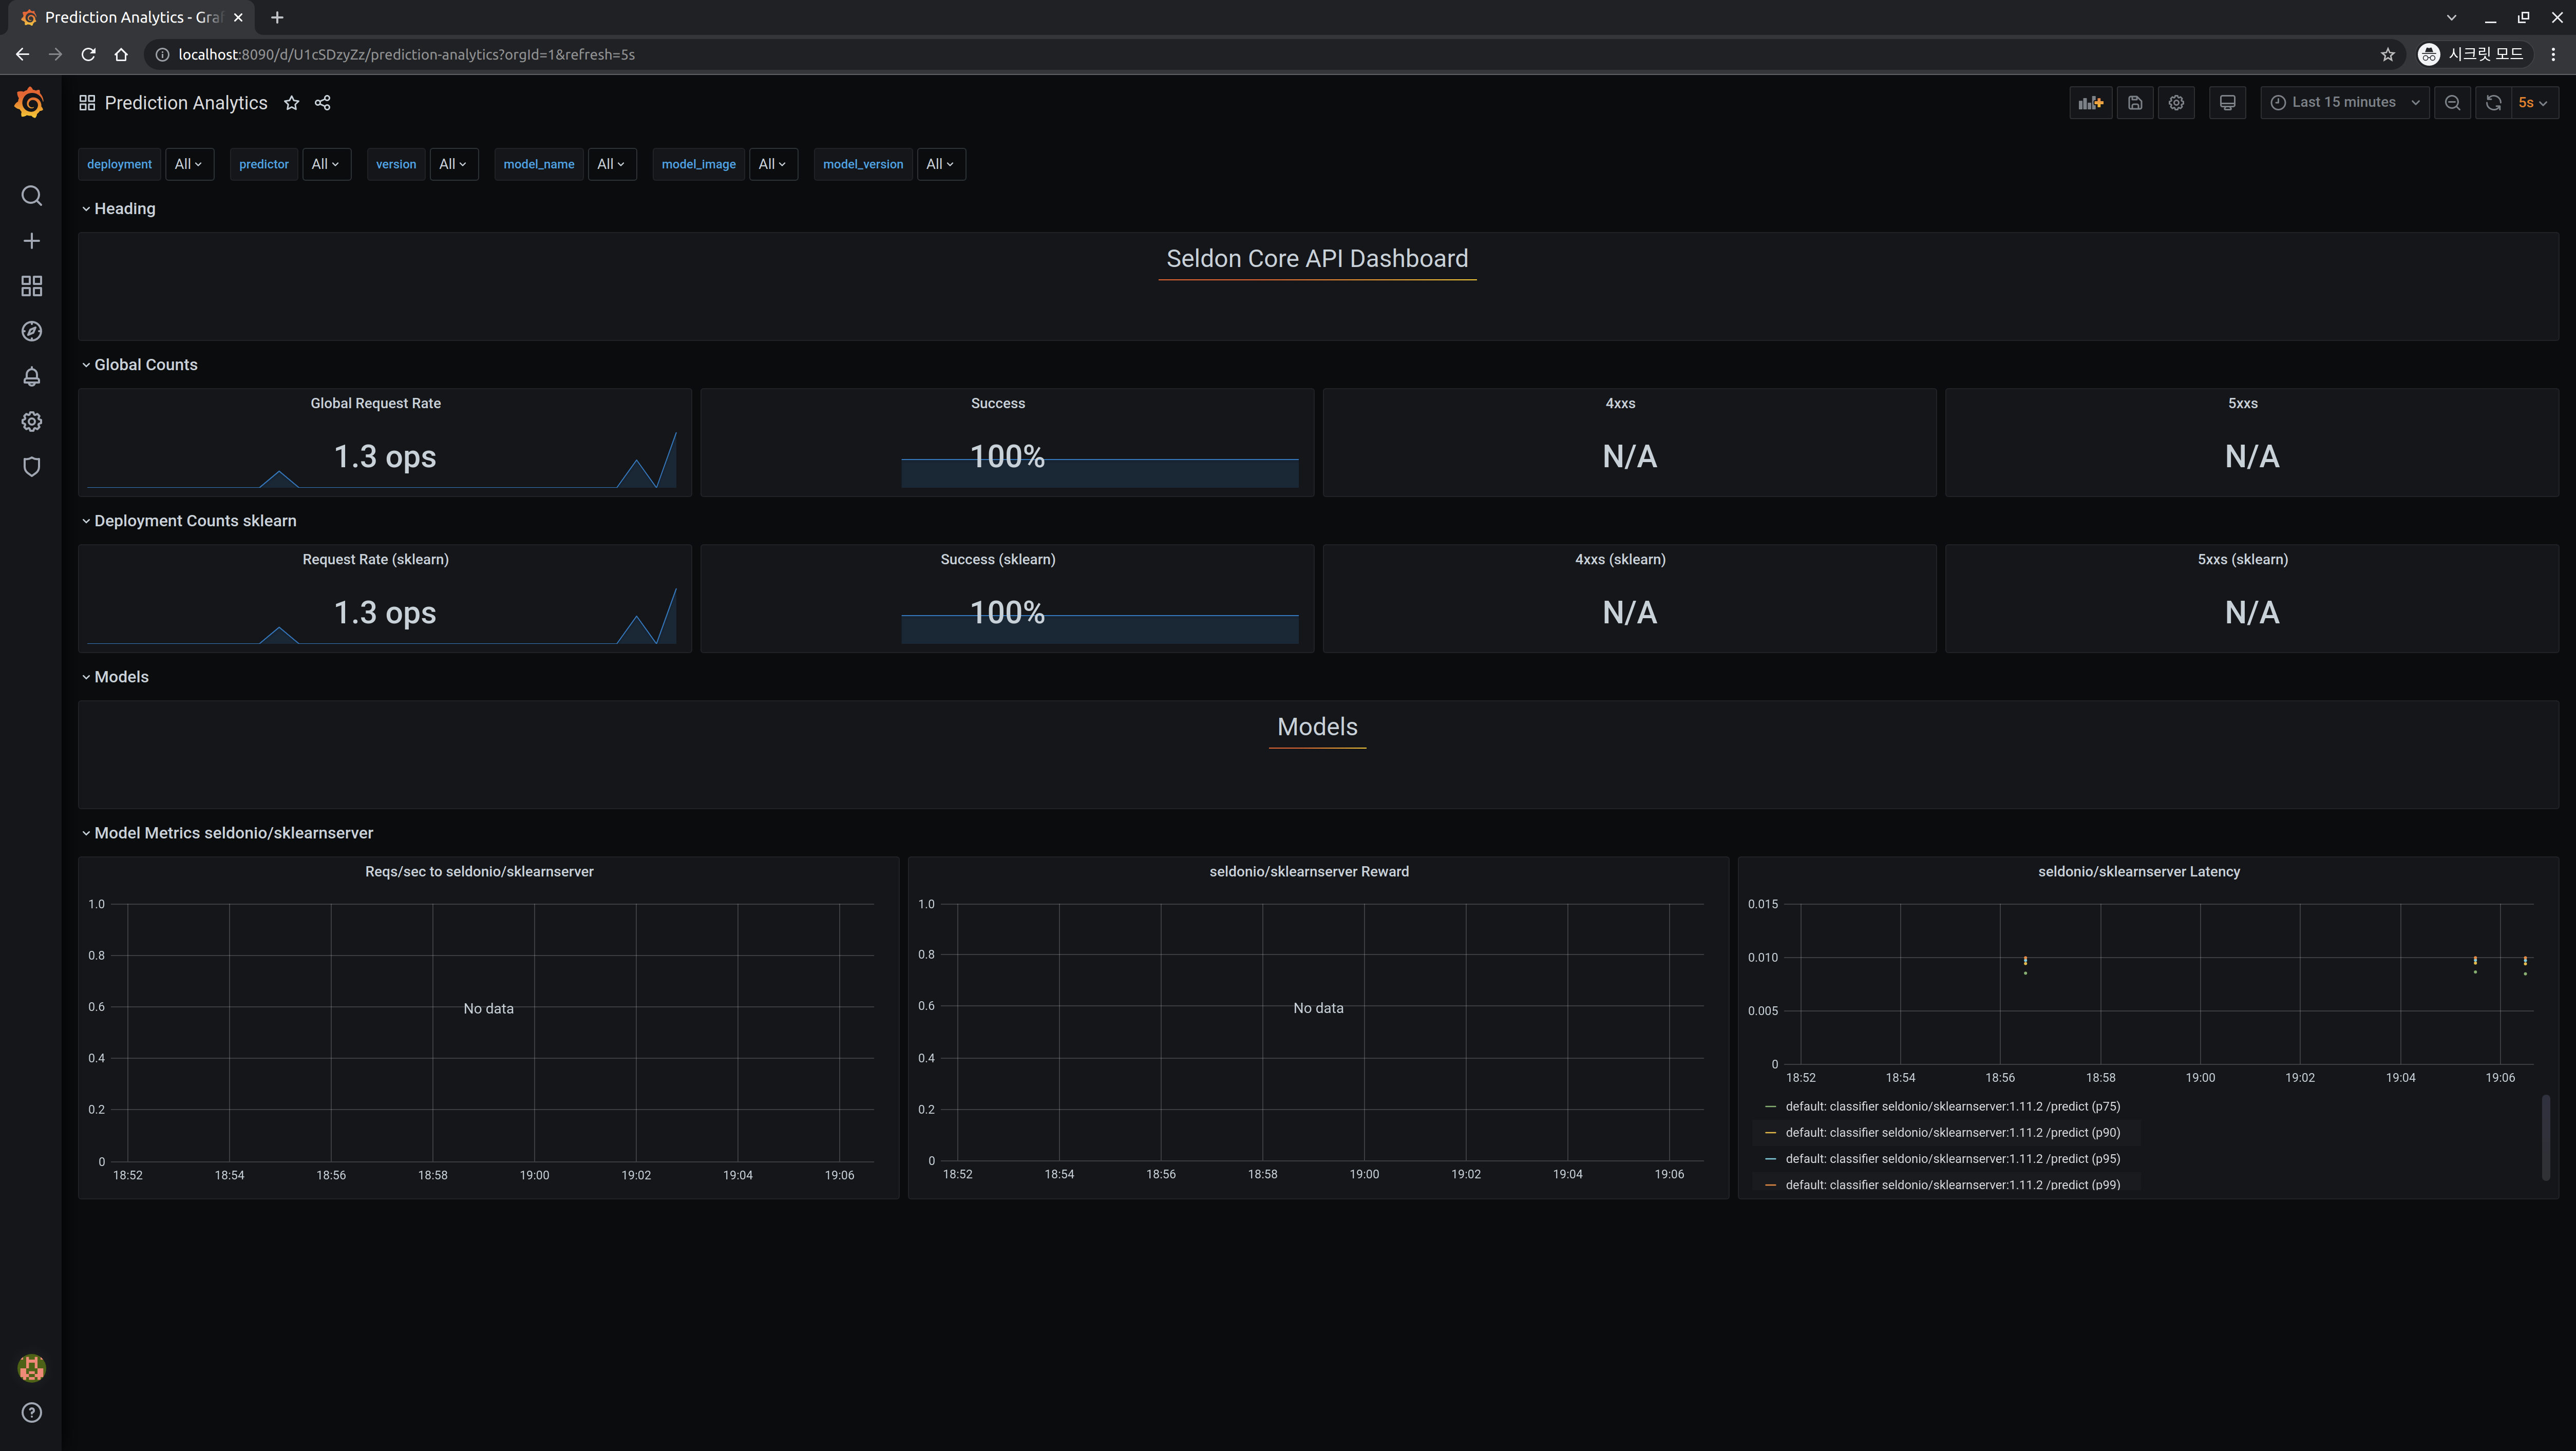
This confirms that Prometheus and Grafana have been successfully installed and configured.